ACS Disease Maps & Management
Current Data is 2018 for Red River Valley, unless noted.
(ND & MN, American Crystal Sugar)
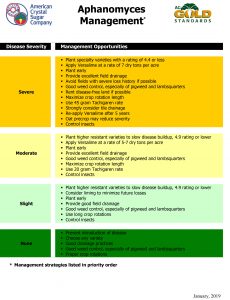
Aphanomyces
Download 2018 ACS Aphanomyces (PDF)
Cercospora (CLS)
2019 CLS Resistance Maps by Township (Source: American Crystal Sugar)
Click for 2019 CLS Resistance Maps
Comments on Cercospora Leafspot (CLS) Maps from 2019 Growing Season
Note: In 2019 for the DMI fungicides, (Eminent, Inspire, Proline & Provysol) Dr. Secor’s research lab provided measurements of resistance levels greater than 10ppm for EC50 values. Being able to have these observations provided greater resolution in the strength of resistance to the DMI fungicide populations. The historical map only showing EC50’s as greater than 10ppm was preserved but a new map was created to show the addition of the detailed data of greater than 10ppm measurements and this map will be referenced in the below comments. This map was segmented for all DMI’s by adding: 10.0001 – 25.0 ppm (VH1); 25.0001 – 50.0 ppm (VH2); >50.0 ppm (VH3). Creating these segments allows the use of the actual ppm measurements greater than 10ppm in creating the township averages.
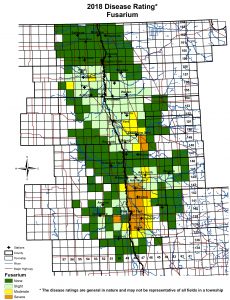
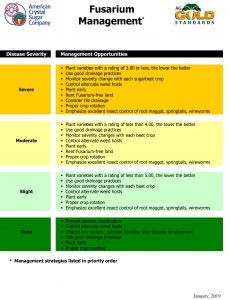
Fusarium
Download 2018 ACS Fusarium (PDF)
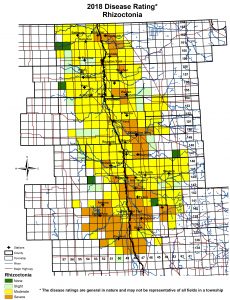
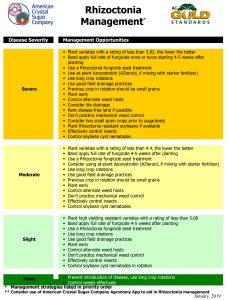
Rhizoctonia
Download 2018 ACS Rhizoctonia (PDF)